Creative teams draw their own conclusions on power of digital graphics

Cathy Loughran
is an editor of the BBC Academy blog
Two separate BBC journalism projects have been exploring the storytelling potential of digital graphics, with surprising results.
One produced an automated EU Referendum results service that crashed a Twitter account and the other has created budget animations of major world stories that are getting unusual viewer engagement.
The experimental work of the BBC’s Visual Journalism unit and the BBC Chinese Service were featured in a recent presentation to BBC staff on innovative storytelling techniques. Here’s what we learned:
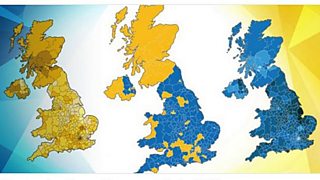
BBC News graphics mapped how areas of the UK voted in the referendum.
Reporting the EU Referendum on social and mobile
Come an election – or a referendum – some things are just easier to present visually on mobile screens than others. Multiple polls, with their mass of information, are tricky, admitted BBC Visual Journalism’s Paul Sargeant. On the other hand, at-a-glance ‘cards’ that spell out where opposing sides stand on various issues or graphic ‘quote cards’ providing politicians’ latest sound bites, are more mobile-friendly. Both went down well with BBC News’s mobile/social audience, particularly hungry for facts in the final days before the EU Referendum, he said.
But once the polls closed, the runaway success for the BBC’s integrated visual team of designers, developers and journalists was its automated results service on Twitter – a polling day first for BBC News.
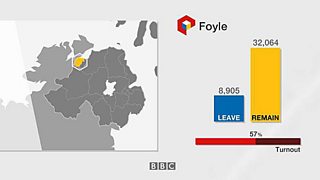
The team set up a machine to run their graphics and created a bot to post them straight to Twitter. But on the day before the polls opened, their test account was literally tested to destruction, when too many results were posted during a rehearsal.
“On the night, the live account was whitelisted by Twitter, so we didn't have to worry about breaking it because there was effectively no limit to the number of posts we could make,” Sargeant explained.
The graphics were shared across BBC social media accounts and HD versions made available to regional TV. The results were also retweeted from the main BBC News account and embedded in Live pages on the BBC News website.
One set of figures stood out, Sargeant felt. For the results service, his team had reactivated an old Twitter account originally used for the 2010 general election. As the polls closed, it had around 10,000 followers and by 8am the next morning it had 50,000.
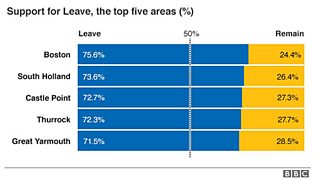
“The issues cards and our regional results maps saw huge traffic but most surprising was the response to the automated results service,” Sargeant said. Expect to see that in action again at the next general election – whenever that might be.
Can we capture the Cultural Revolution in a cartoon?
When China announced last October that it was ending its one-child policy, the BBC Chinese Service wanted to add value to its reporting of this massive social and economic change in the form of a video explainer. They needed to react quickly so for their first attempt at animation, they turned to one of their own journalists, talented illustrator Weiliang Nie, and used two apps (Procreate and Animation Creator) to animate his drawings.
Their next opportunity to experiment came with China’s historic pledges on the environment, ahead of last November’s COP21 climate change conference in Paris. It took just two days to produce a two-minute visual explainer (above) – complete with simple, digitally painted images of industrial chimneys, wind farms and Beijing Marathon runners in masks – to flag up the key questions over whether the country will be able to deliver on its promises.
By now the London-based team had added the new Apple Pencil to its animation toolbox. The simple four-step process they’d adopted by necessity – idea, 200-word script, basic illustration, simple animation – remained the same.
Perhaps their biggest challenge so far came in May with the 50th anniversary of the Cultural Revolution. They looked for a simple idea that would nevertheless convey the reality of that period in China’s history in a cartoon, said Chinese Service editor Zhuang Chen: “Could we recreate what an average day looked like for ordinary Chinese, 50 years ago? That idea came from a colleague’s parent who had lived through it.”
The resulting stark images of regimented lives (above) “moved” the audience, Chen said. The video also achieved an unusually high 80% retention rate (four out of five viewers watched the whole 1 min.30 secs). The climate change animation had scored 72%.
The editor makes no apology for the almost child-like simplicity of the graphics: “If a simple animation is fit for your purpose and you need a quick response, I’d say take the initiative.” Otherwise, said Chen, decide early on what it is the audience most wants to know and think hard about which images will best convey that information.
Visual Journalism Unit: Multiplatform collaboration
More on visualisation in the Academy section on Multimedia journalism
Blog: A stripped down telling of some of the world’s toughest stories
Blog: How a graphic novel style can tell the most powerful of human stories