What is a time graph?
A time graph is a line graph which shows you data that has been collected over a period of time.
There is a title which tells you what the data in the time graph is about.
The horizontal (X) and vertical (Y) axes or lines are labelled to tell you what data has been collected and when.
The horizontal axis is a line which goes straight across from left to right.
The vertical axis is a line which goes up and down.
The vertical axis is on the left hand side of the graph and moves upwards from the horizontal axis.
Activity: How to read a time graph
Complete this interactive activity to understand how to read information in a line graph. Then put your knowledge to the test.
Reading a time graph
A time graph is a line graph that shows data collected over time.
Take a look at this one.
To understand what a time graph is showing you, you need to look at three things:
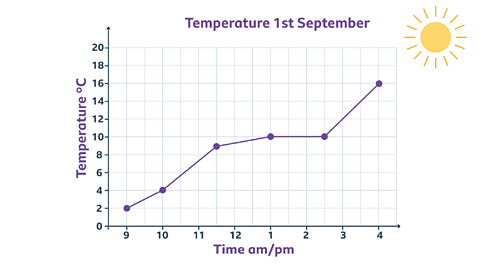
1. Title - The title tells you what the graph is about. For example, "Temperature on the First of September."
2. Horizontal Axis - This axis moves from left to right at the bottom of the graph.
3. Vertical Axis - This axis moves from the horizontal axis upwards.
Once you know what the graph is about, you can read the data.
You should always look at the scale on a time graph. The scale may go up in ones or count in steps. It might not show every number.
For example, on this graph, the vertical axis goes up in steps of 2 degrees. Even though 7 degrees and 9 degrees are not shown, they are still represented between the labeled points.
Example 1
This time graph shows the measurement of a sunflower each week as it grew from a seed.
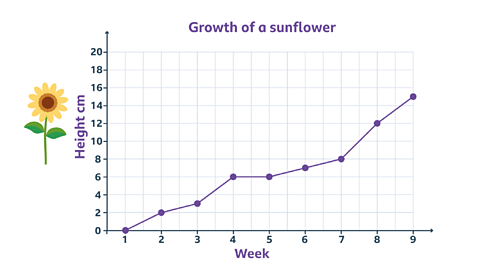
How much did the sunflower grow from week 3 to week 8?
✓ The answer is 9cm.
In Week 3 the plant measured 3cm.
In Week 8 it measured 12 cm.
The difference between 3cm and 12cm is 9cm.
12 - 3 = 9
Example 2
Here is a table showing the number of cars outside the school gates between 3:00 and 3:30.
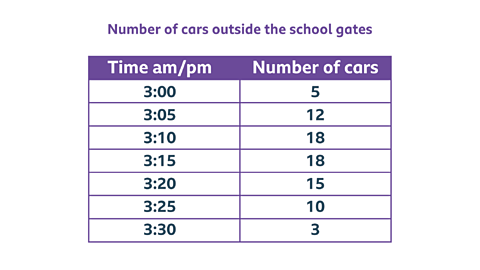
The data from this table has been put into a time graph.
The time is in five minute increments on the horizontal axis and the number of cars is on the vertical axis.
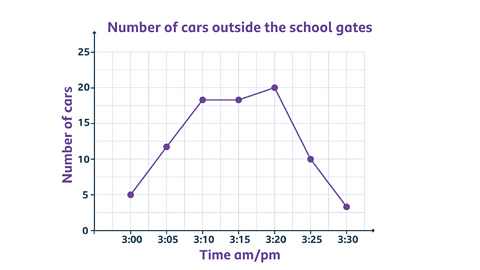
Can you spot where an error has been made?
✓ The number of cars for 3.20pm has been incorrectly plotted on the time graph.
It should show 15 as the data in the table shows.
Example 3
This graph shows Jamie's car journey.
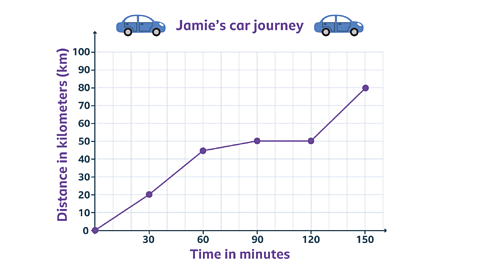
How long has it taken Jamie to travel 50km?
✓ First you slide up the vertical axis to 50km.
Then you the travel across to meet the line.
Then you travel straight down to reach the horizontal axis which reads 90 minutes.
It has taken Jamie 90 minutes to travel 50km.
NEW! Play Guardians: Defenders of Mathematica - the winter update. game
It's Mathematica as you’ve never seen it before, with all-new festive backgrounds and costumes. Available for a limited time only. Use your maths skills to save the day before it's too late!

More on Tables, graphs and charts
Find out more by working through a topic
- count1 of 2